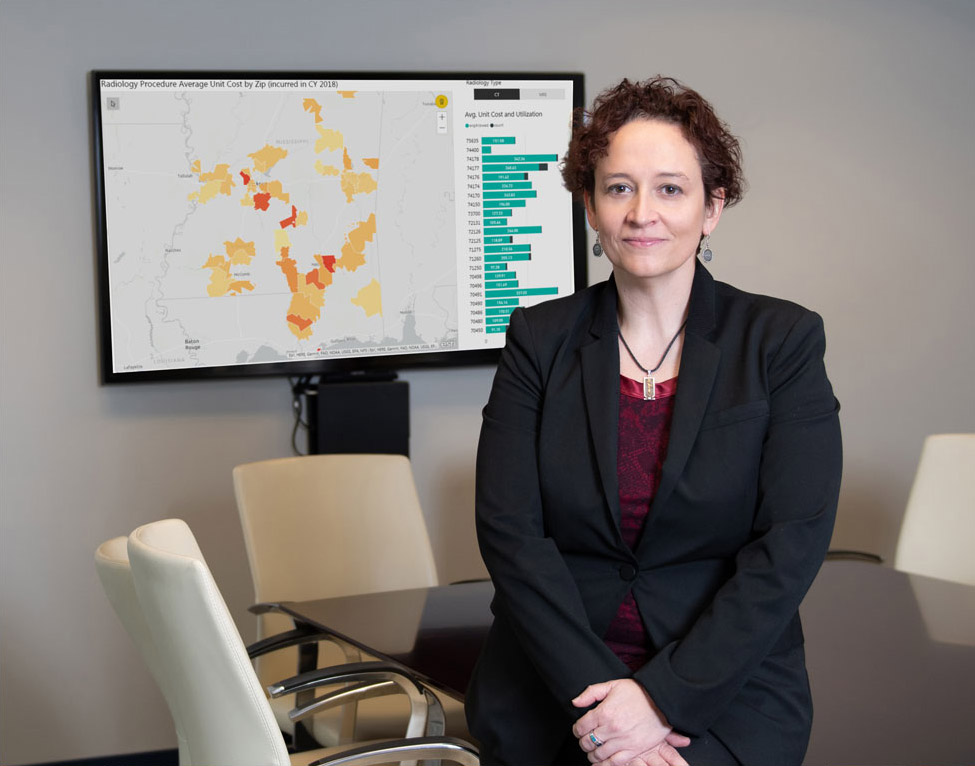
What is Data Visualization?
Data visualization summarizes complex data using graphics. It enables users to decipher large collections of data to:
- Discover patterns
- Unearth anomalies or outliers
- Identify trends
- Interpret results

How Can Data Visualization Help Health and Welfare Plan Sponsors?
Ways we can help you target problems and develop solutions include:
- Examining claim patterns
- Mapping the geographic usage of your preferred provider network
- Reviewing the effectiveness of your wellness program
- Examining usage patterns of emergency rooms
- Showing the prevalence of diagnoses among your covered employees

What Kinds of Data Visualization Techniques Does Cheiron Use?
- Heat maps
- Bubble graphs
- Scatter plots
- Geographic or geospatial maps
- 3-D charts
